Analytics
With over 10 years in the analytics industry, I turn raw data into actionable insights that help businesses make smarter, faster decisions. Using tools like Python, SQL, and interactive dashboards, I provide custom reports and visualizations tailored to your goals. Whether you need to track performance, uncover trends, or optimize processes, I deliver clear, personalized analytics solutions that empower your business.
Who Actually Needs Analytics Help?
Analytics can be useful for businesses that have data but aren't sure what to do with it, are spending too much time building reports manually, or need a clearer way to understand what is happening in the business.
You may benefit from analytics support if you are tracking sales, customers, operations, performance, website activity, inventory, finances, or other business data and need help turning that information into something easier to understand and use.
Common Problems I Help Solve
What You Get From an Analytics Project
Every project depends on your business needs, but deliverables may include:
Do You Need a Dashboard, or Is Excel Enough?
Not every business needs a full dashboard.
If your data is small, updated occasionally, and only needs simple calculations or reporting, Excel or Google Sheets may be enough.
A dashboard may make more sense when you need to monitor multiple metrics, combine information from different sources, update reports regularly, or give multiple people an easier way to understand business performance.
The goal is not to build something complicated just because I can. The goal is to use the right tool for the problem you're trying to solve.
What Does an Analytics Project Cost?
Analytics projects with Apps by Ashlee typically start around $200-$500 for simpler projects. More complex projects involving multiple data sources, custom dashboards, recurring automation, or predictive analysis can range significantly higher depending on scope.
View Analytics PricingWhat Can Analytics Help You Do?
Business Outcome Examples
Example: Understanding Customer Activity
A business may have sales or customer data but no easy way to see which services are growing, which are slowing down, or when customer activity changes.
An analytics project can organize that information into a clear report or dashboard so the owner can quickly see trends and decide where to focus attention.
Example: Reducing Manual Reporting
A business may spend hours every week pulling numbers from multiple spreadsheets and rebuilding the same report.
That reporting process can be cleaned up or automated so the business spends less time preparing numbers and more time actually using them.
Real-World Analytics Example
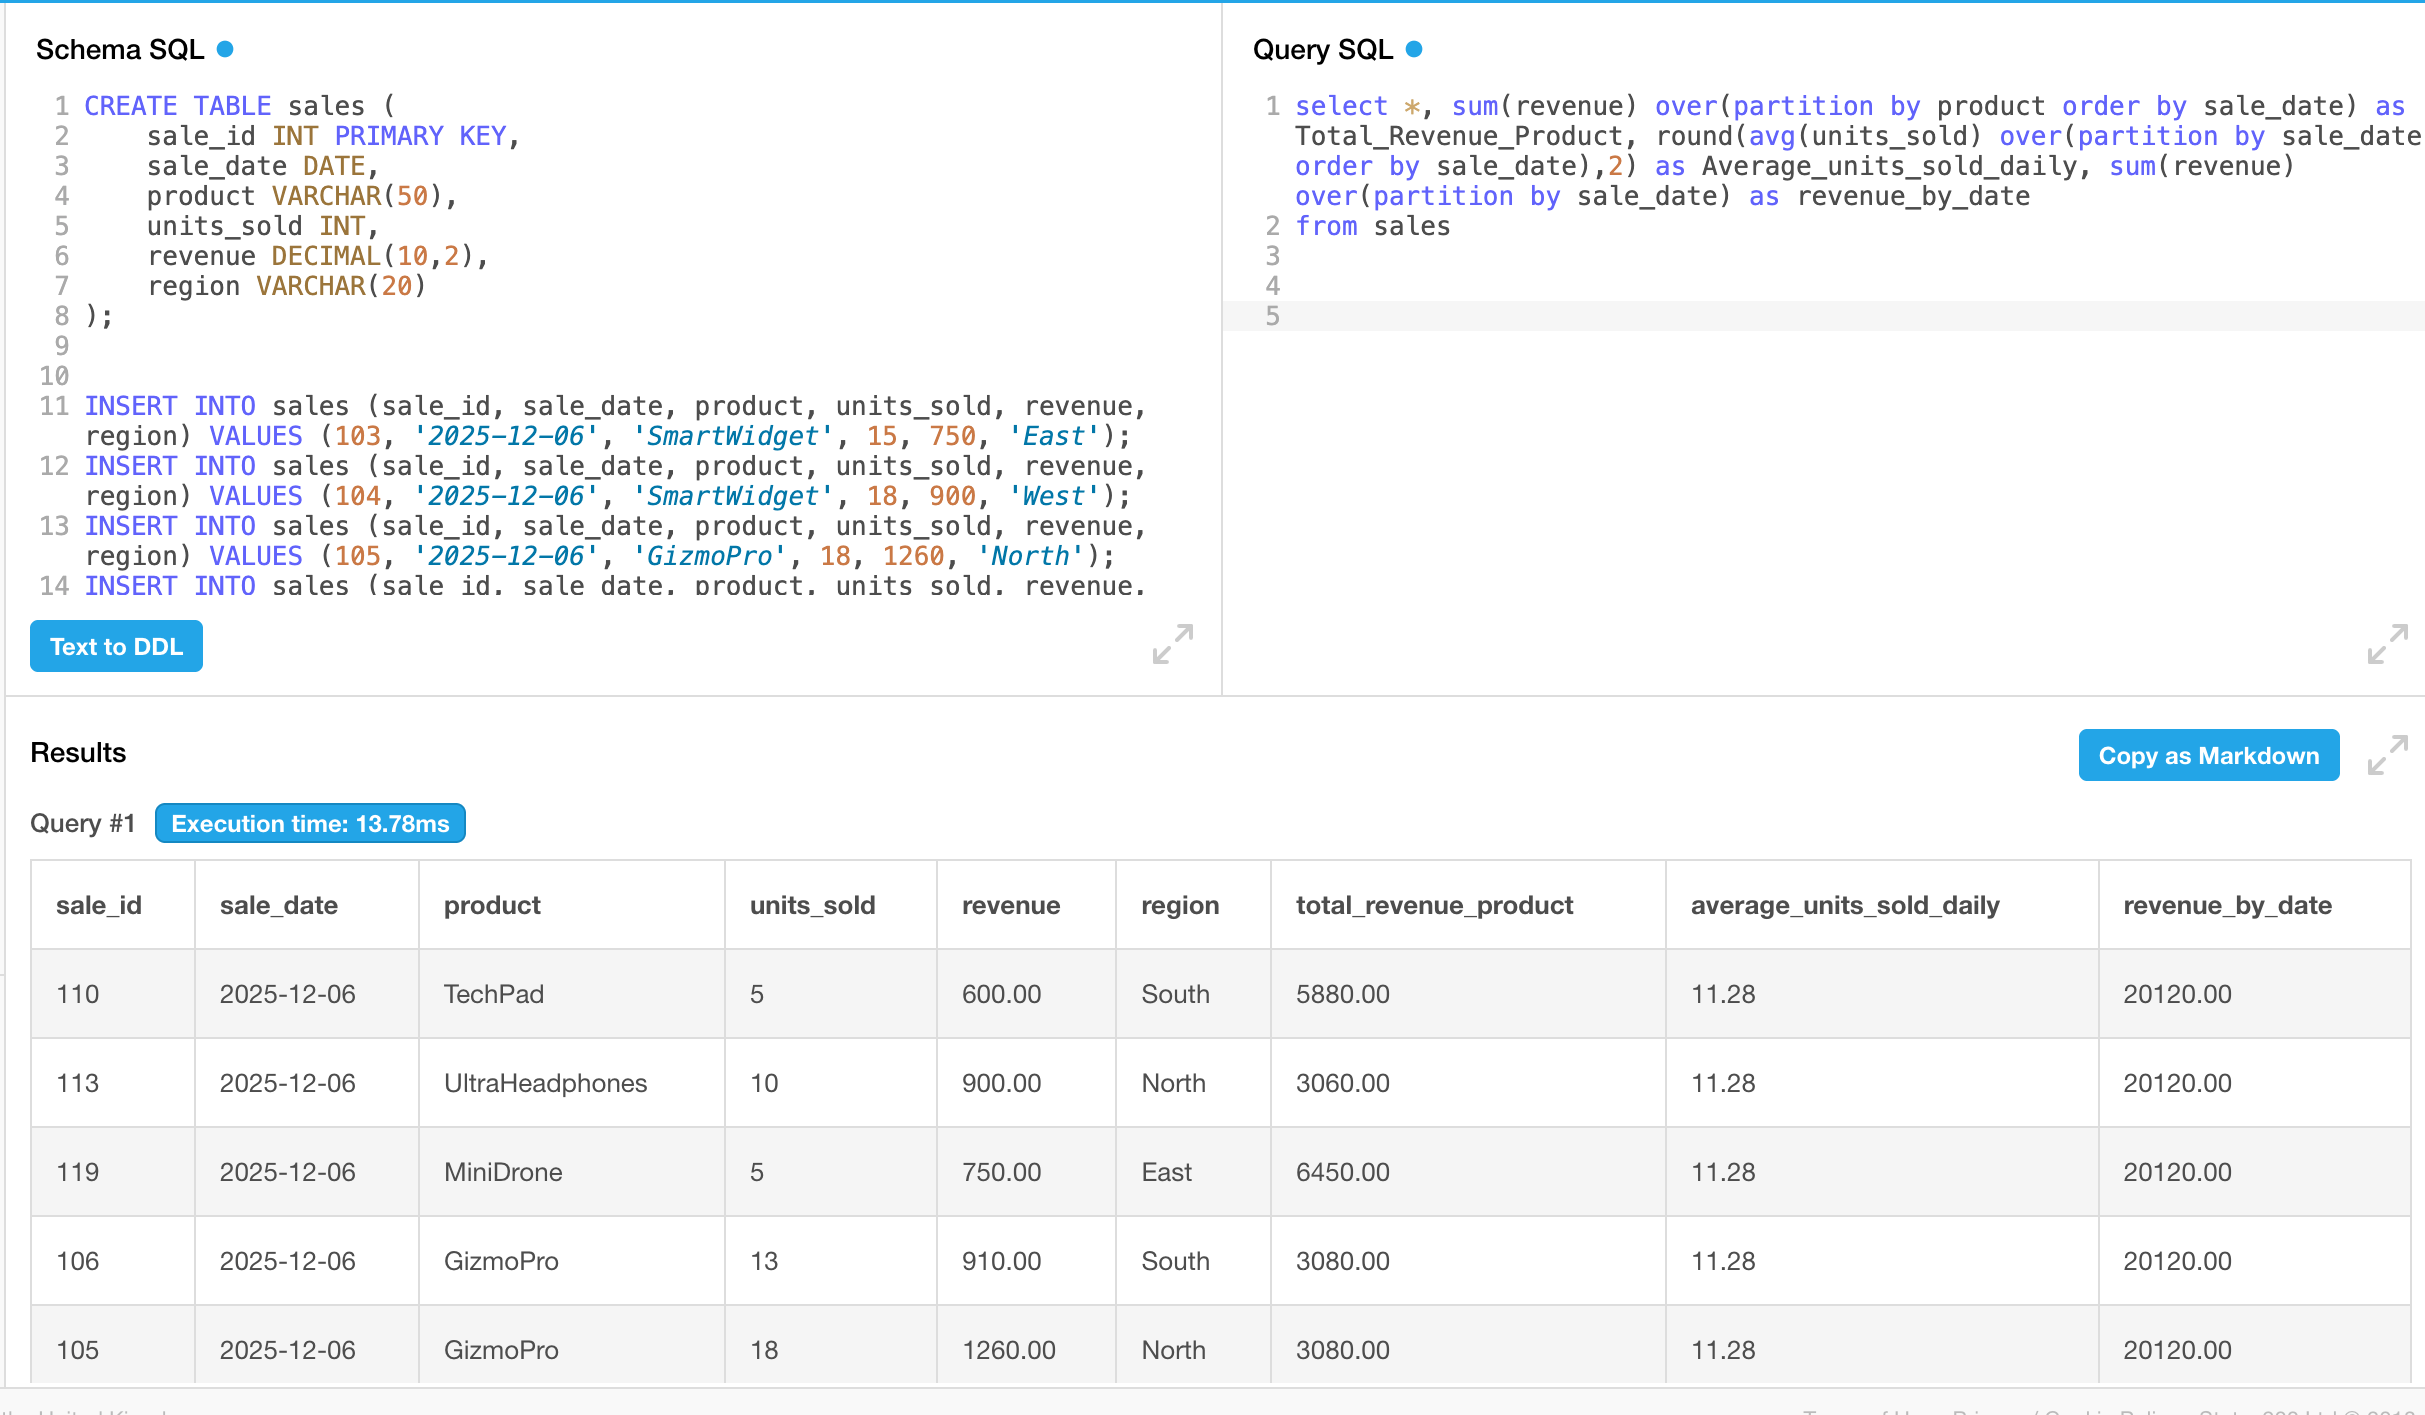
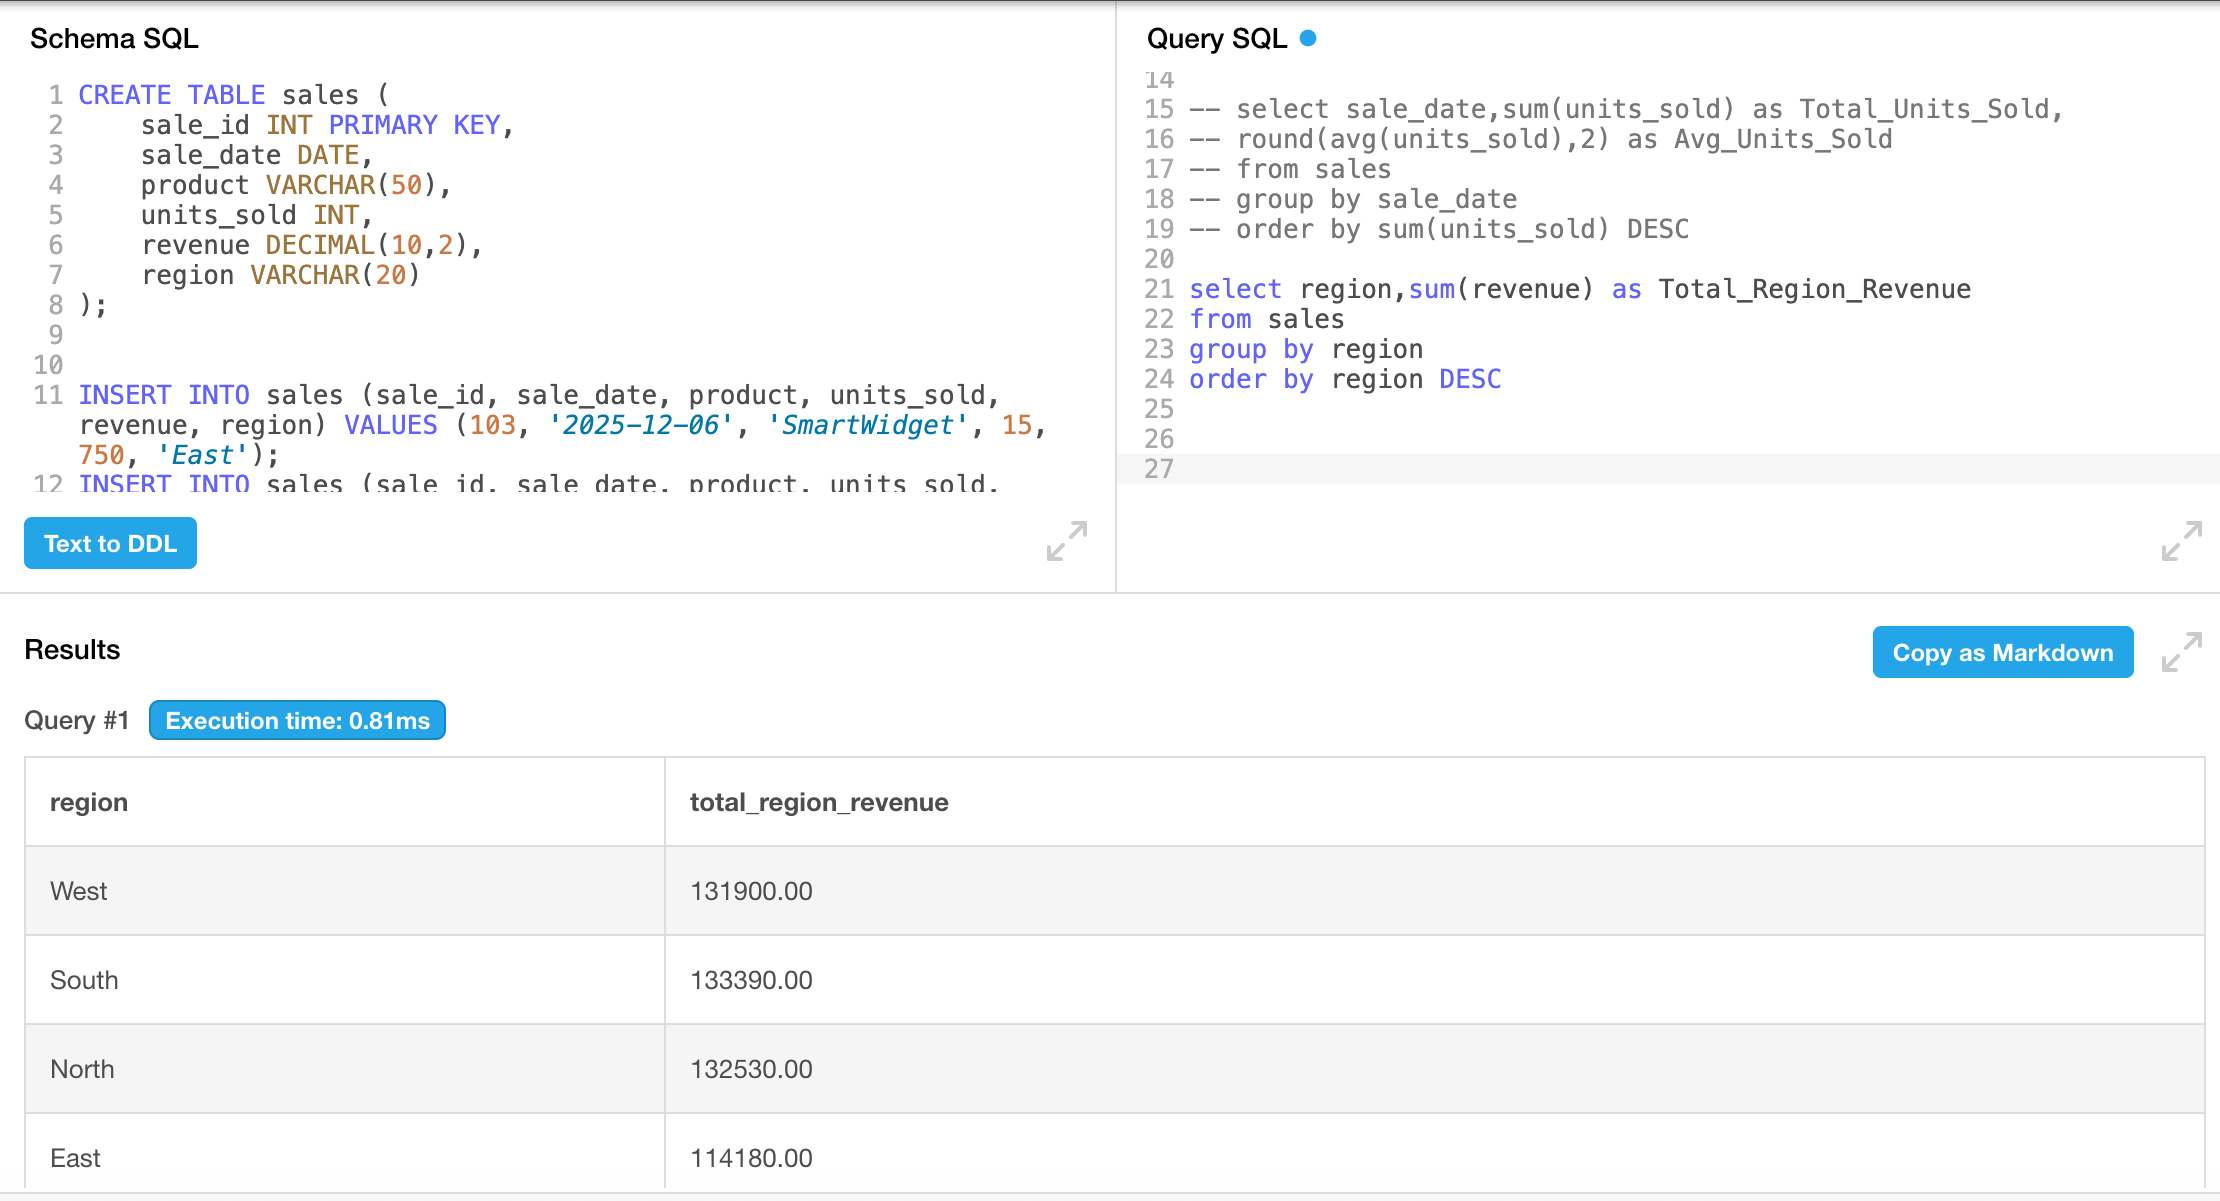
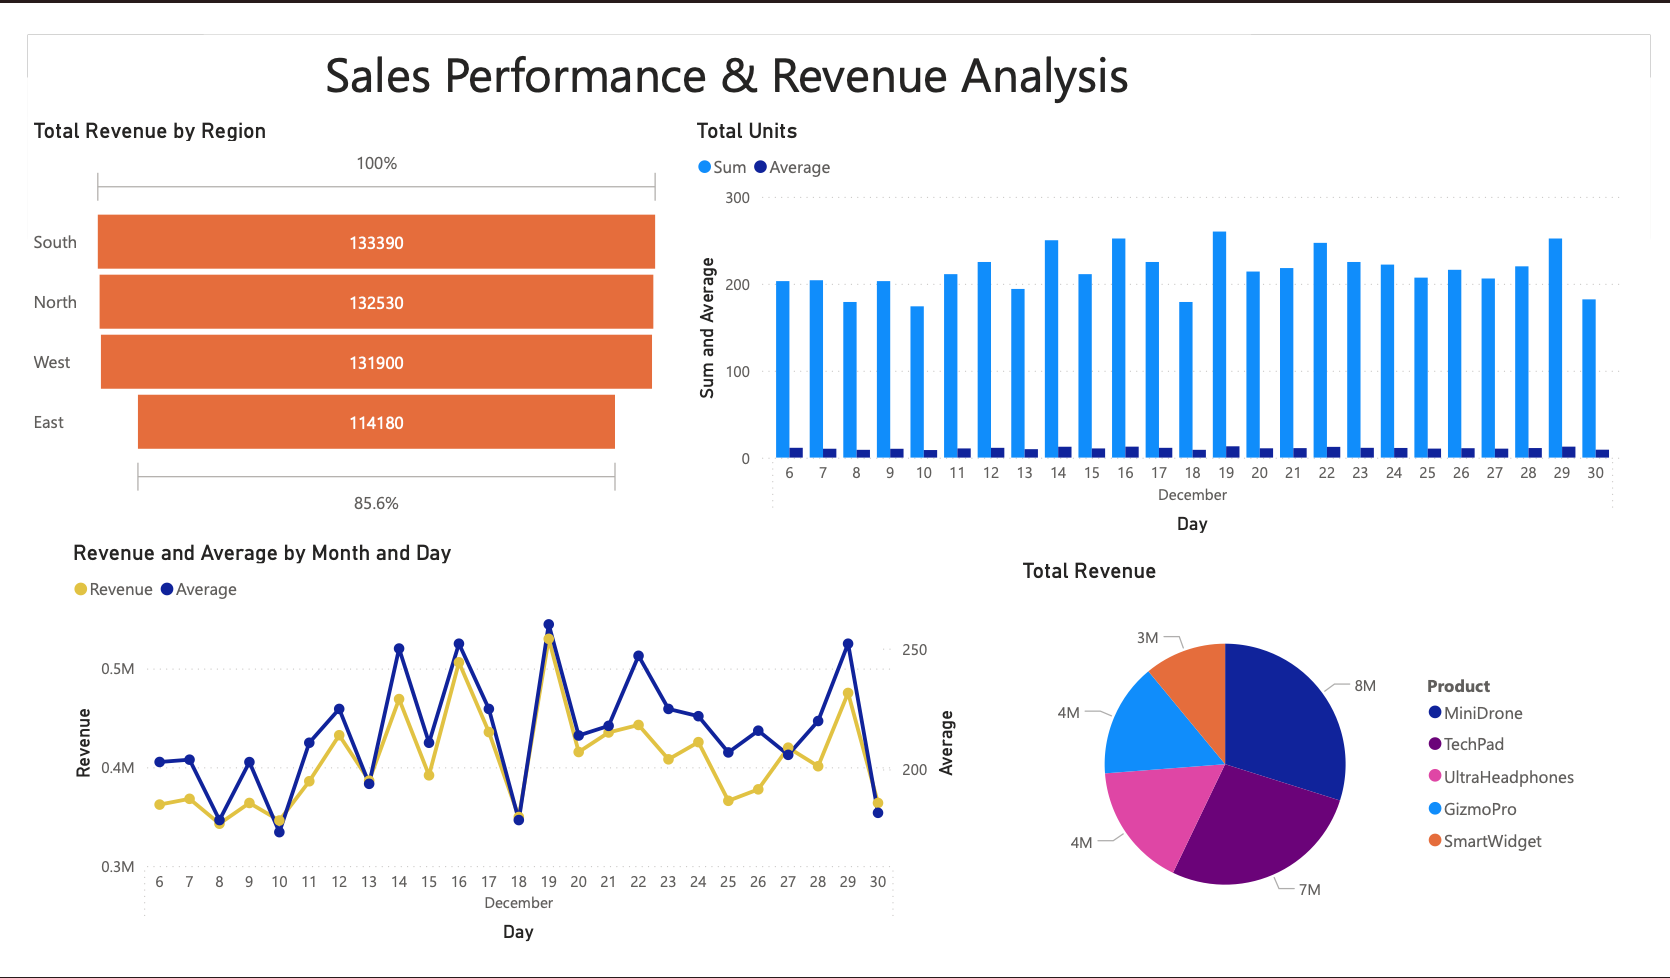
This analysis helped identify regional revenue differences and product performance patterns. Power BI and SQL tools were utilized.
Behind the Analysis